契合团队工作习惯的
财务报表解决方案

您的财务团队早已熟练掌握 Excel。Jet Reports 可直连 Dynamics 365 Business Central,让团队只需轻松一键,即可构建、刷新并共享精准的财务报表。
亲眼见证 Excel 实时报表操作示范。
了解更多 >
了解财务团队如何运用 Jet Reports。
了解更多 >
卓越财务团队的异曲同工之处
能够更快速完成结算的财务团队,皆依赖单一数据源(Single Source of Truth),而非人工导出的电子表格。
Jet Reports 将 Excel 转化为实时报表环境,即时反映您的 ERP 数据。
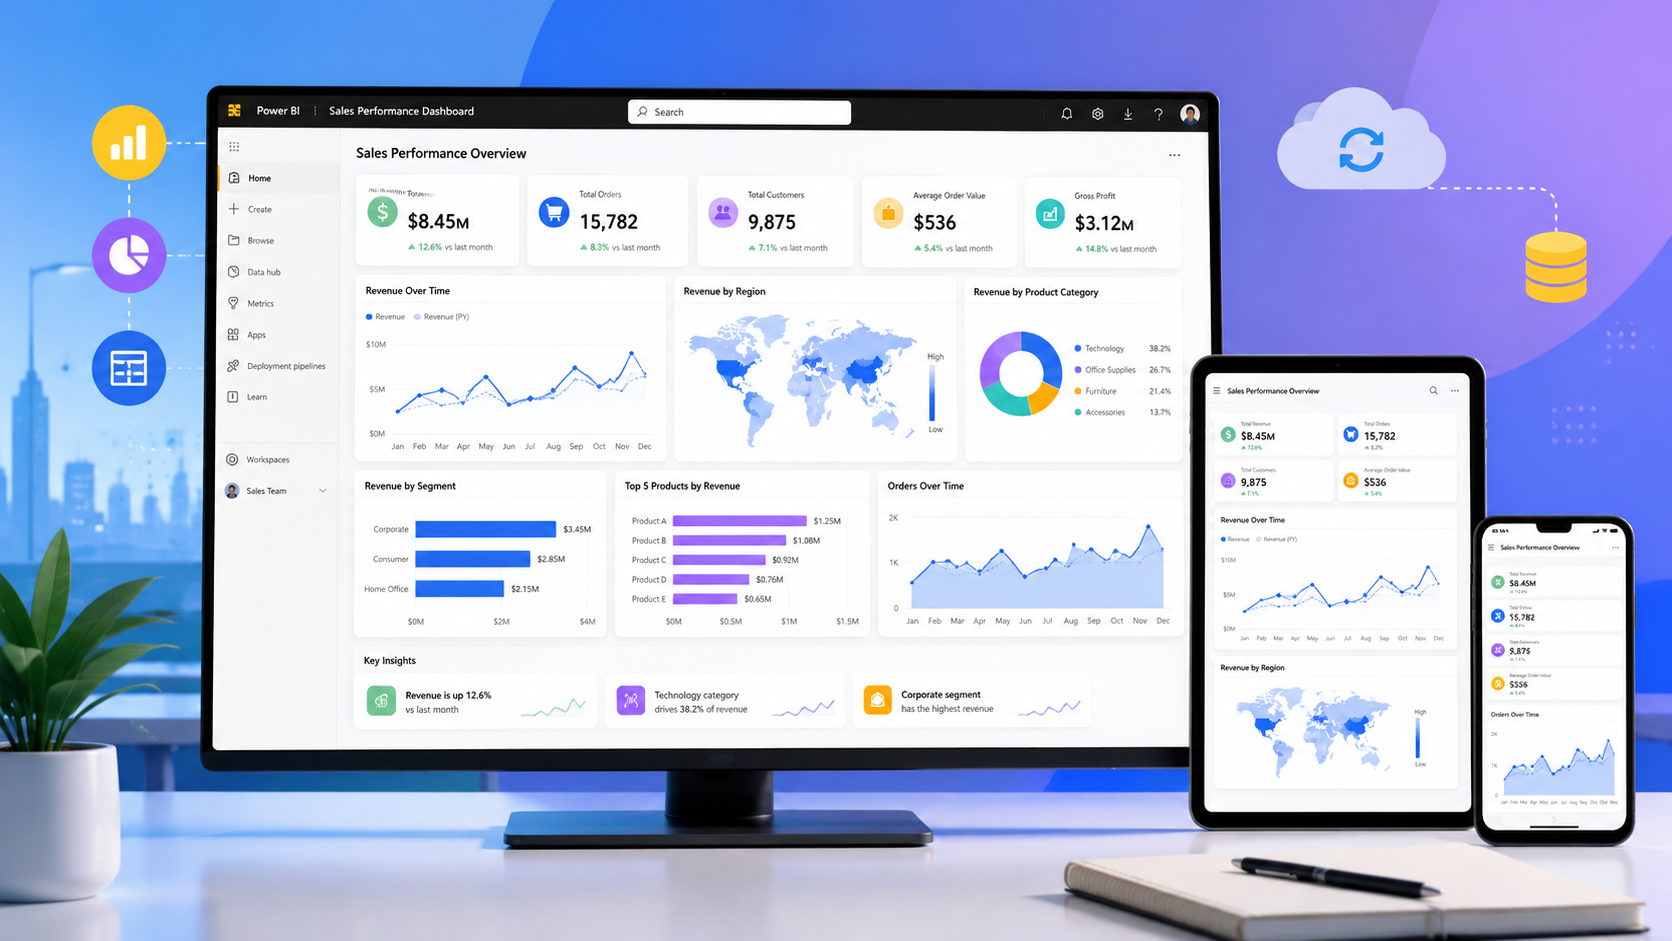
Power BI sales performance dashboard displayed on a desktop monitor, tablet, and smartphone, showing metrics including total revenue $8.45M, total orders 15,782, total customers 9,875, average order value $536, and gross profit $3.12M, alongside charts of revenue over time, revenue by region world map, revenue by product category pie chart, revenue by segment bar chart, top 5 products by revenue, and orders over time line graph, with key insights highlighted at the bottom.
Live ERP Data in Excel

Pull real-time data directly from Dynamics 365 Business Central into Excel, no manual exports, no copy-pasting, no waiting for an IT refresh.

Power BI sales performance dashboard displayed on a desktop monitor, tablet, and smartphone, showing metrics including total revenue $8.45M, total orders 15,782, total customers 9,875, average order value $536, and gross profit $3.12M, alongside charts of revenue over time, revenue by region world map, revenue by product category pie chart, revenue by segment bar chart, top 5 products by revenue, and orders over time line graph, with key insights highlighted at the bottom.
No Coding Required

Build and modify reports using Excel's familiar interface and Jet's intuitive drag-and-drop functions, accessible to any finance team member, not just developers.

Power BI sales performance dashboard displayed on a desktop monitor, tablet, and smartphone, showing metrics including total revenue $8.45M, total orders 15,782, total customers 9,875, average order value $536, and gross profit $3.12M, alongside charts of revenue over time, revenue by region world map, revenue by product category pie chart, revenue by segment bar chart, top 5 products by revenue, and orders over time line graph, with key insights highlighted at the bottom.
Ready-to-Use Templates

Access a library of pre-built templates for P&L statements, balance sheets, AR/AP summaries, cash flow reports, and more, ready to use from day one.

Power BI sales performance dashboard displayed on a desktop monitor, tablet, and smartphone, showing metrics including total revenue $8.45M, total orders 15,782, total customers 9,875, average order value $536, and gross profit $3.12M, alongside charts of revenue over time, revenue by region world map, revenue by product category pie chart, revenue by segment bar chart, top 5 products by revenue, and orders over time line graph, with key insights highlighted at the bottom.
Multi-Company Reporting

Consolidate data across multiple companies or legal entities into a single report, ideal for group structures, holding companies, and multi-site businesses.

Power BI sales performance dashboard displayed on a desktop monitor, tablet, and smartphone, showing metrics including total revenue $8.45M, total orders 15,782, total customers 9,875, average order value $536, and gross profit $3.12M, alongside charts of revenue over time, revenue by region world map, revenue by product category pie chart, revenue by segment bar chart, top 5 products by revenue, and orders over time line graph, with key insights highlighted at the bottom.
Drill-Down Capability

Navigate from summary reports directly to the underlying transactions in Business Central, giving finance teams the full detail they need for accurate reconciliation.

Power BI sales performance dashboard displayed on a desktop monitor, tablet, and smartphone, showing metrics including total revenue $8.45M, total orders 15,782, total customers 9,875, average order value $536, and gross profit $3.12M, alongside charts of revenue over time, revenue by region world map, revenue by product category pie chart, revenue by segment bar chart, top 5 products by revenue, and orders over time line graph, with key insights highlighted at the bottom.
Automated Scheduling

Schedule reports to refresh and distribute automatically on a daily, weekly, or monthly basis, eliminating repetitive manual tasks from your reporting cycle.

Power BI sales performance dashboard displayed on a desktop monitor, tablet, and smartphone, showing metrics including total revenue $8.45M, total orders 15,782, total customers 9,875, average order value $536, and gross profit $3.12M, alongside charts of revenue over time, revenue by region world map, revenue by product category pie chart, revenue by segment bar chart, top 5 products by revenue, and orders over time line graph, with key insights highlighted at the bottom.
Role-Based Access Control

Ensure sensitive financial data is accessible only to the right people, maintaining compliance and data governance across your reporting environment.

Power BI sales performance dashboard displayed on a desktop monitor, tablet, and smartphone, showing metrics including total revenue $8.45M, total orders 15,782, total customers 9,875, average order value $536, and gross profit $3.12M, alongside charts of revenue over time, revenue by region world map, revenue by product category pie chart, revenue by segment bar chart, top 5 products by revenue, and orders over time line graph, with key insights highlighted at the bottom.
AI Report Assist

Jet's AI-powered assistant helps users build, customize, and refine reports faster using natural language prompts, available in Jet Reports Online.


Open laptop on a desk displaying a spreadsheet with sales data, including tables, bar charts, a pie chart showing sales by category, and a monthly profit trend graph. The spreadsheet shows sales summary, top 5 products data, and various financial metrics. Next to the laptop are a white notebook with a black pen, a stack of papers titled Q2 Performance Report with charts, a coffee mug, and a small potted plant. Background shows a bookshelf and a window.
核心功能
Excel 直连 ERP 实时数据

直接将 Business Central 的实时数据拉取至 Excel 中,无需手动导出、无需复制粘贴,更无需等待 IT 部门刷新数据。

零代码门槛

运用 Excel 熟悉的界面与 Jet 的拖拽式功能即可构建和修改报表,任何财务团队成员都能轻松上手。

开箱即用的报表模板

提供预置的损益表(P&L)、资产负债表、应收/应付款项(AR/AP)汇总及现金流量表模板,上线第一天即可直接使用。

多公司与多法人实体报表

将多个公司或法人实体的数据合并至单一报表中,完美契合集团化及多据点运营架构的需求。

数据下钻分析功能(Drill-Down)

可从汇总报表直接穿透下钻至 Business Central 中的底层交易明细,为财务团队提供完整的对账细节。

自动化定时分发

支持设置按日、按周或按月自动刷新并分发报表,彻底消除重复性的手工操作。

基于角色的权限控制

确保敏感财务数据仅限授权人员访问,全面保障报表发布过程中的合规性与数据治理。

AI 报表助手

Jet 的 AI 助手允许用户通过自然语言提示词(Prompts)更快速地构建、定制与优化报表。

经大规模验证的实力
深受全球财务团队信赖
10,000+
全球超过 10,000 家企业
正在使用 Jet Reports
insightsoftware
原生集成
原生集成 Dynamics 365 Business Central、NAV 及 GP
insightsoftware
无
无需额外连接器
或数据仓库
insightsoftware
数据来源:insightsoftware、Jet Reports 产品文档及微软 AppSource 中的 Jet Reports 应用页面。
常见问题解答
什么是 Jet Reports?

Jet Reports 是一款基于 Excel 的财务与业务报表解决方案,专为微软(Microsoft)Dynamics 365 Business Central、Dynamics NAV 及 Dynamics GP 量身打造。它将 Excel 直接与实时 ERP 数据相连,助力财务团队在无需编写代码或手动导出数据的情况下,轻松创建、自动化分发及共享精确的报表。

Jet Reports 与 Dynamics 365 Business Central 原生内置报表有何不同?

Business Central 虽然内置了 300 多种标准报表,但在自定义与排版灵活性方面相对有限。Jet Reports 让财务团队能够直接在 Excel 中完全掌控报表设计、计算逻辑与版面布局,同时依然调用来自 Business Central 的实时精确数据。团队无需等待 IT 部门支持,即可按照喜好的格式快速生成所需的报表。

我们的团队成员是否需要学习全新的软件?

不需要。Jet Reports 直接在 Excel 中运行,而这正是大多数财务团队每天都在使用的工具。其学习成本极低,用户可利用现有的 Excel 技能配合 Jet 直观的功能,轻松调用并格式化 Business Central 数据。Tectura 瀚资还将提供专业培训,帮助您的团队快速上手。

Jet Reports 是否支持多公司或多法人实体的报表合并?

支持。Jet Reports 支持在单张报表中实现跨多个公司或法人实体的数据合并,非常适合集团化架构、控股公司以及在中国内地等多地运营的企业。

什么是 Jet Reports Online?

Jet Reports Online 是 Jet Reports 的云端版本,专为在云端使用 Dynamics 365 Business Central 的企业设计。该版本于 2025 年初发布,不仅支持与 Excel 桌面端及 Excel Online 无缝集成,还内置了 AI Report Assist,允许用户通过自然语言提示词(Prompts)构建与优化报表。

Jet Reports 如何与 Power BI 形成优势互补?

et Reports 与 Power BI 满足不同但互补的业务需求。Jet Reports 精于结构化、格式化的财务报表,例如财务团队定期在 Excel 中制作的详细财务报表、差异分析及各类明细表。而 Power BI 则更擅长交互式可视化仪表板与更广泛的运营分析。许多企业会选择双管齐下:利用 Jet Reports 进行财务报表分析,同时借助 Power BI 构建管理层仪表板并提升跨部门数据透明度。